Modernize your PowerBuilder Applications
Ultimate Suite for PowerBuilder
PowerCharts
Add a modern presentation layer to existing DataWindows
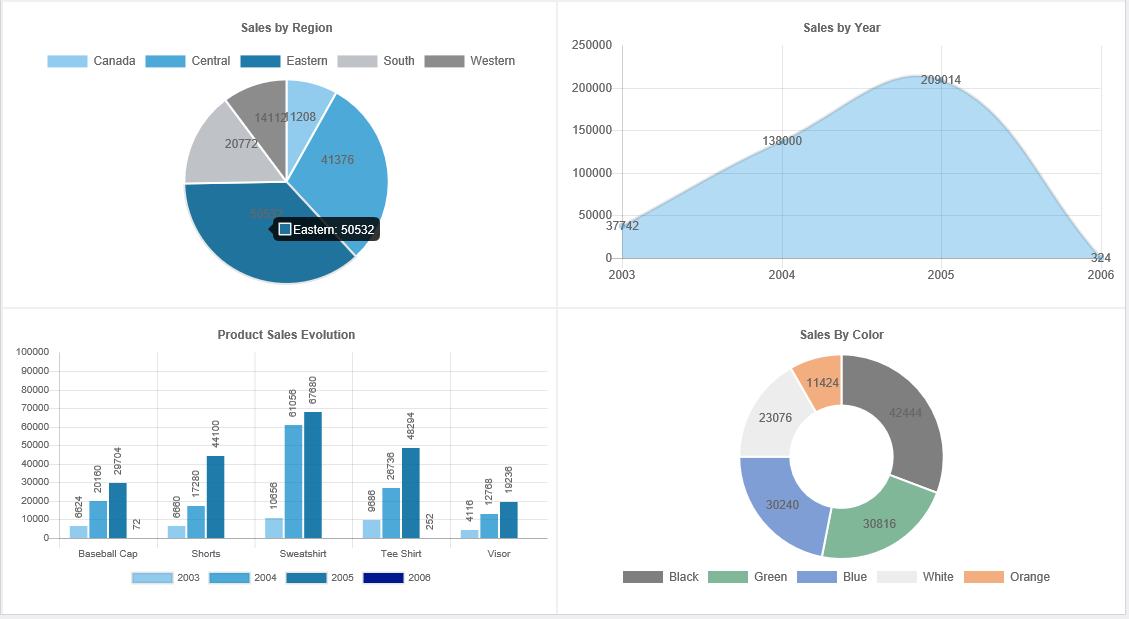
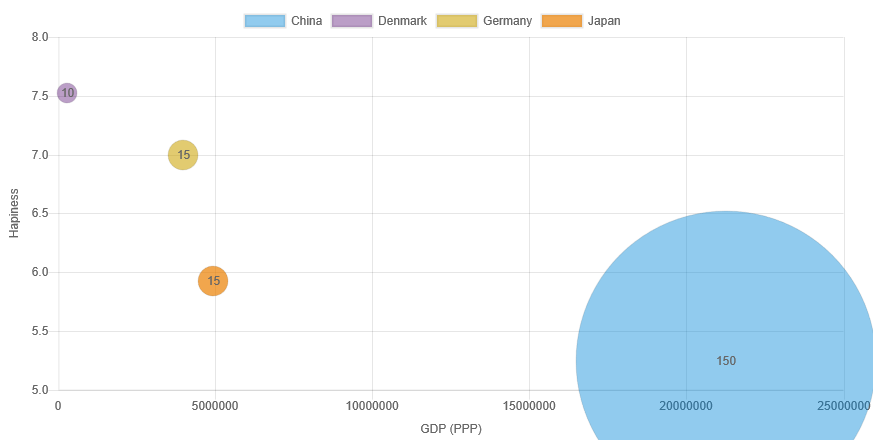
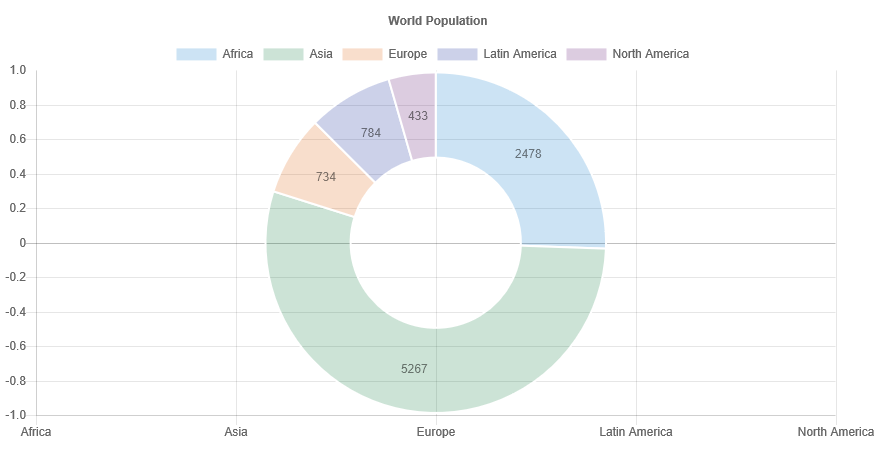
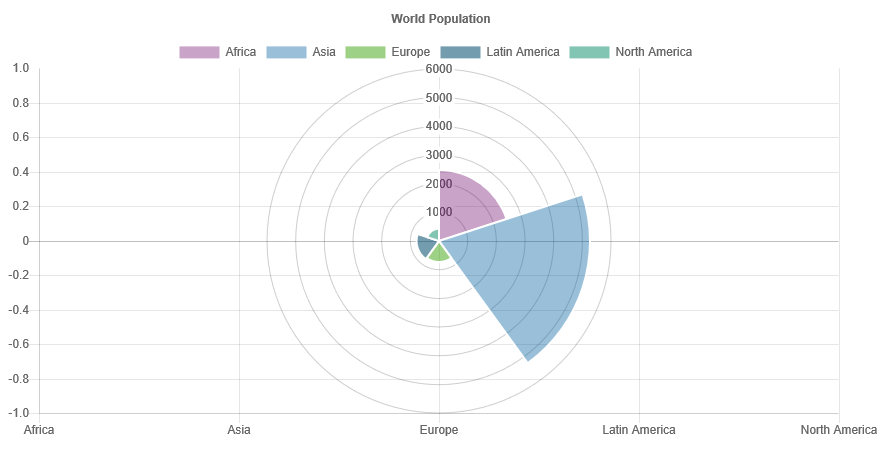
Ultimate Suite for PowerBuilder Chart control comes with a dozen types of Charts: Pie charts, horizontal bars, vertical bars, stacked bars, lines, areas, spider, doughnut, radar, polar area, bubble, scatter...

PowerChart offers a large choice of features to visualize and explore data:
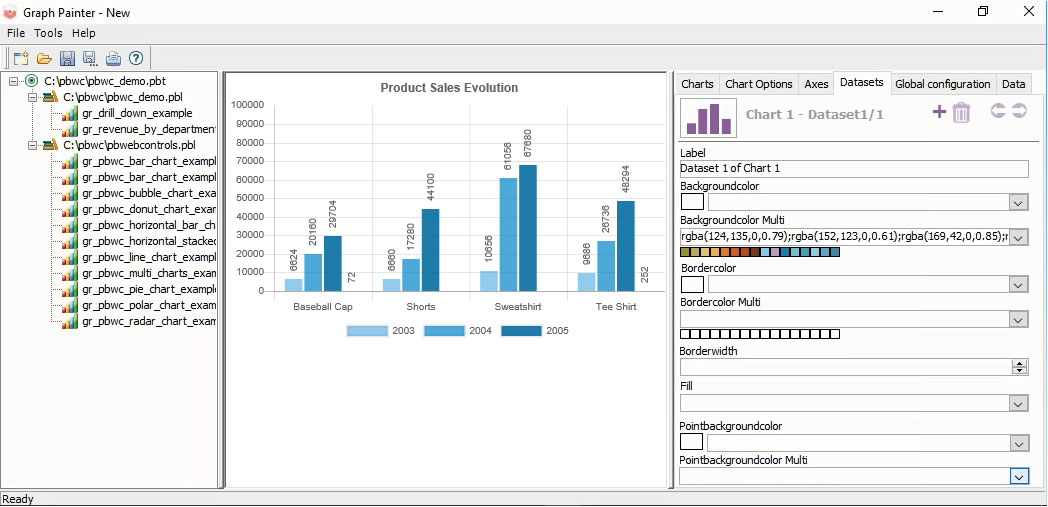
- Customize PowerCharts with a painter, or change them dynamically by program.
- Use an existing PowerChart as a template and apply it to multiple DataWindows.
- Animate PowerCharts when they open.
- Show tooltips with real-time data when users hover a value.
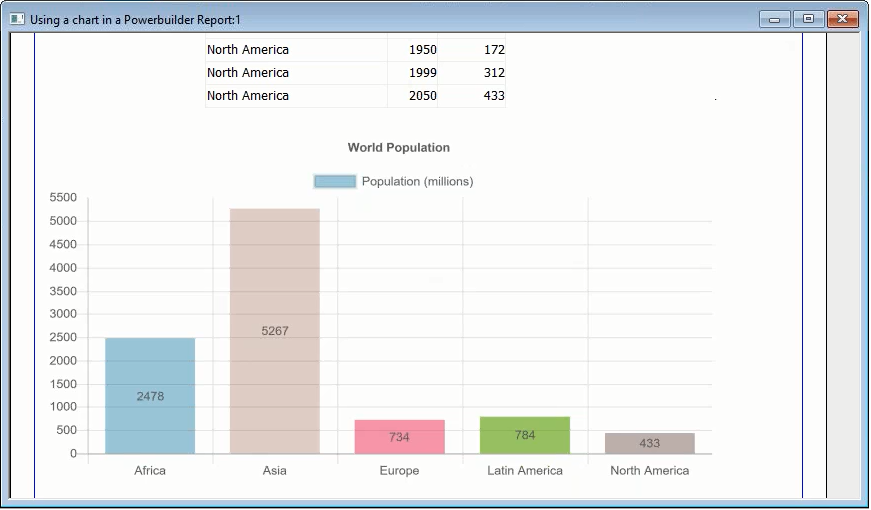
- Embed PowerCharts in PB Reports to print them out.
- Compose modern animated dashboards with several PowerCharts.
- Implement drill-down features: control what happens when users double-click on a value. For instance, they navigate from one clickable chart to another and break down a given chart value into several other Charts.
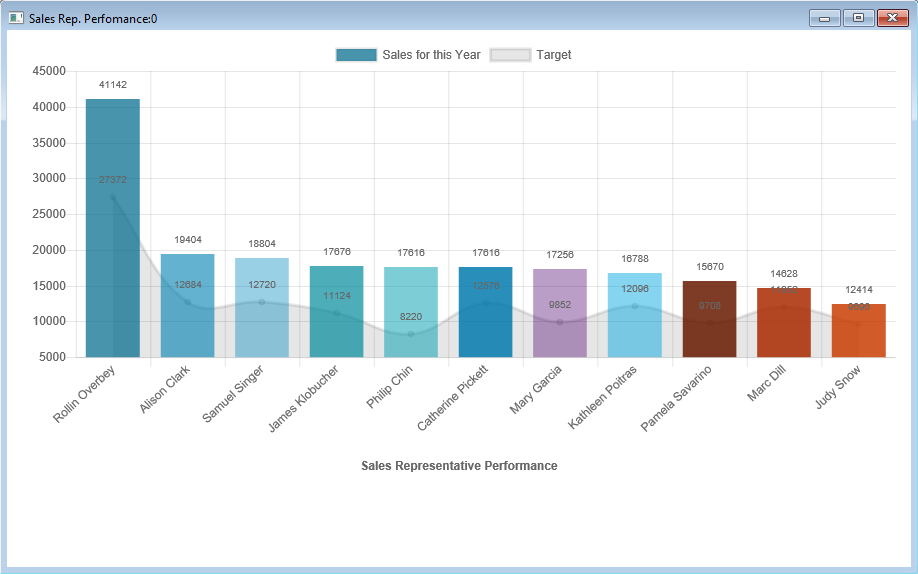
- Combine several graphs in a single PowerChart, for instance Bar chart + line.
- Synchronize several charts with master/details dependencies.
- Export a full working graph with its data, animations, and popups into a single HTML file. Share it via email, even publish it on an Intranet or MS Sharepoint site.
- And much more...
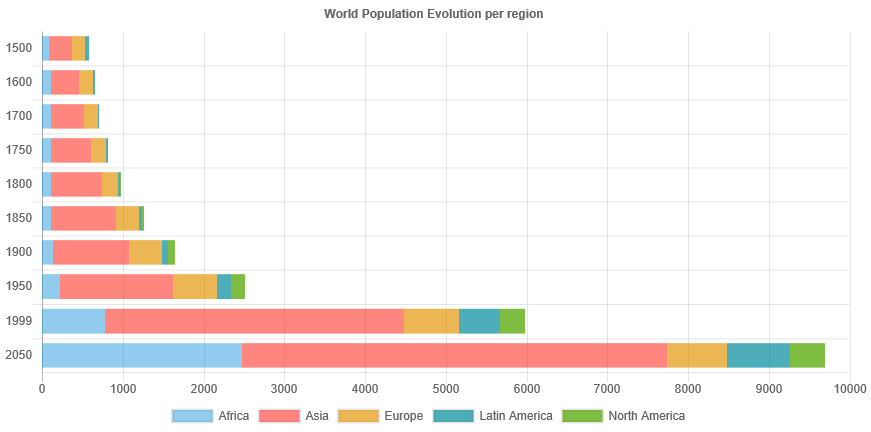
Mouse over the bar graphs to see hierarchical data via tooltips