Creating the datasource
Create a datawindow that will be used as the data source of your graph. Its data source can be external, a SQL query, a stored procedure or a web service. The datawindow can have retrieval arguments of any types. This datawindow must include :
-The label column for the graph.
-The value column for each label.
-The dataset (series) column (Optional), if you want do design a graph that contains series.
Note : If you need to create a graph that will include more than 1 chart (currently, the chart.js engine lets you add line charts to any bar or line chart) you must create 1 datasource datawindow for each chart.
Creating the graph object
Run the chart.js datawindow painter (from the Powerbuilder toolbar if you installed it on the tool bar).
The chart.js datawindow will scan the registry to determinate your current PowerBuilder application and to connect to the database to which the Powerbuilder IDE is currently connected. If it is the first time you run the painter for a specific database, it will ask for the database password in order to connect.
The Chart.js datawindow will then display the libraries of your current application and all the chart.js datawindow object that they contain.
There are 2 ways for creating a new graph. You can edit an existing one and use saveas function. This enables you to not spent time designing a new graph each time you need to create a new one. Just create the source data datawindow, edit and existing graph already well designed and just change the datasource. You can also create a new graph from scratch by selecting the New menu in the chart.js datawindow painter.
To know the meaning of a specific parameter, just put the mouse pointer on its label for 2 seconds.
If the parameter you have specify do not comply with the chart.js engine, it will trigger a javascript error. Some time you will need to reload you graph to avoid the error.
Note : By default the chart.js datawindow painter will display most common parameters. If you are familiar with the chart.js engine, you can display more advanced parameters by selection the menu option in the tool menu.
Charts tab
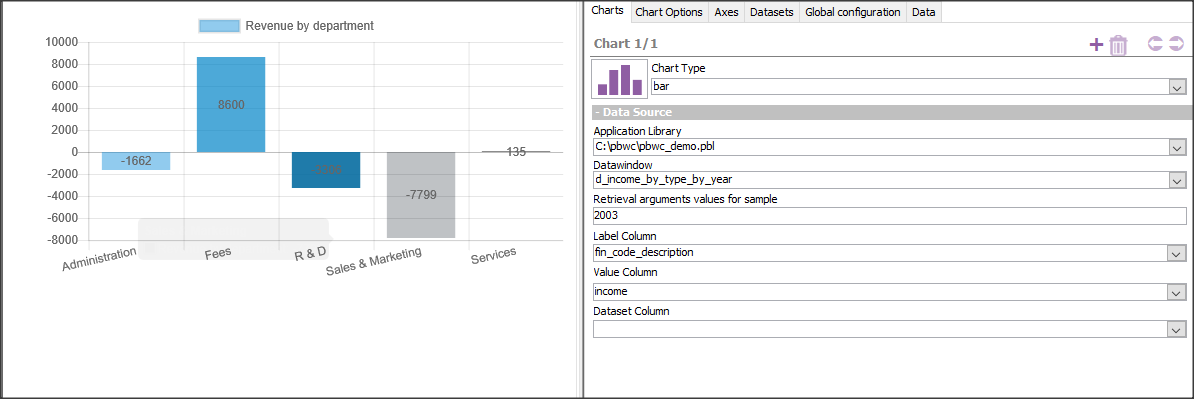
The main tab to use when building a graph is the charts tab. The chart.js engine lets you build multiple chart in the same graph. This is limited right now to adding line charts to master bar charts or line charts (to show the min/max/avg lines for example).
In most case, you will just define one chart for your graph.
Just select the source data datawindow, specify a retrieval argument list (CSV list) if it needs retrieval arguments to display some sample data and then specify the Label column, the Value column and if needed the Dataset (series) column for 3 dimensional data.
Note: Retrieval argument values can be referenced in parameters such as the chart title. The syntax is {retrieval_argument_n} where n is the argument number. If your chart includes multiple datasources, you must reference the argument by adding the datasource number : {retrieval_argument_n[d]} where d is the datasource number.
Axes tab
By default the graph will display 2 axis tab. The y axis will be positioned on the left and the x axis at the bottom. You can customize the way the axis are displayed, specify the scale to use, the legends to display.depending on the king of chart you are using. You can also define a specific label for each axis.
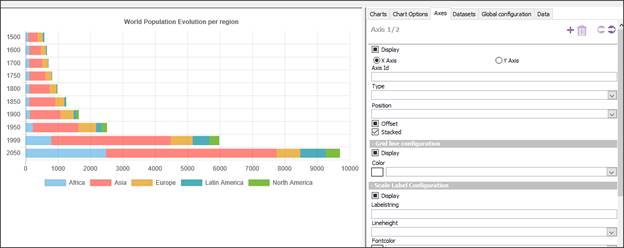
For bar charts, you can specify on the Axes tab on what axes you want the data to be stacked.
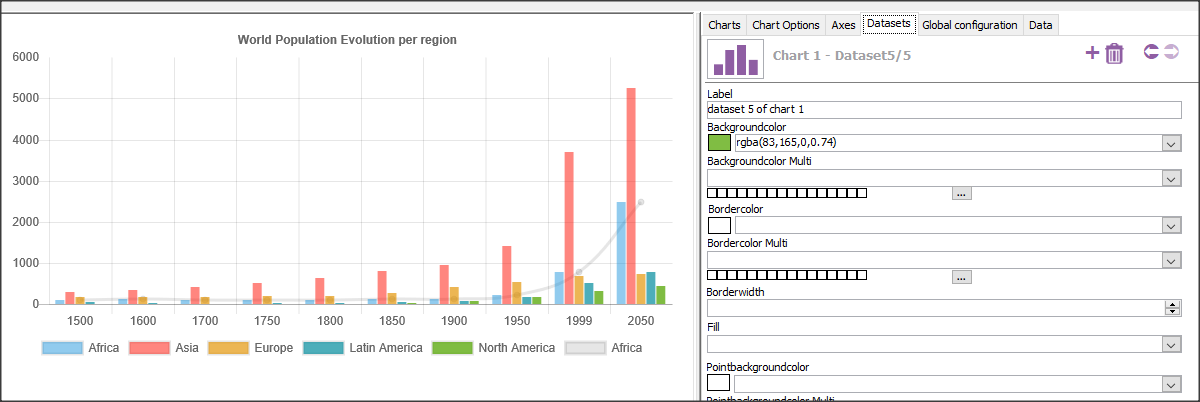
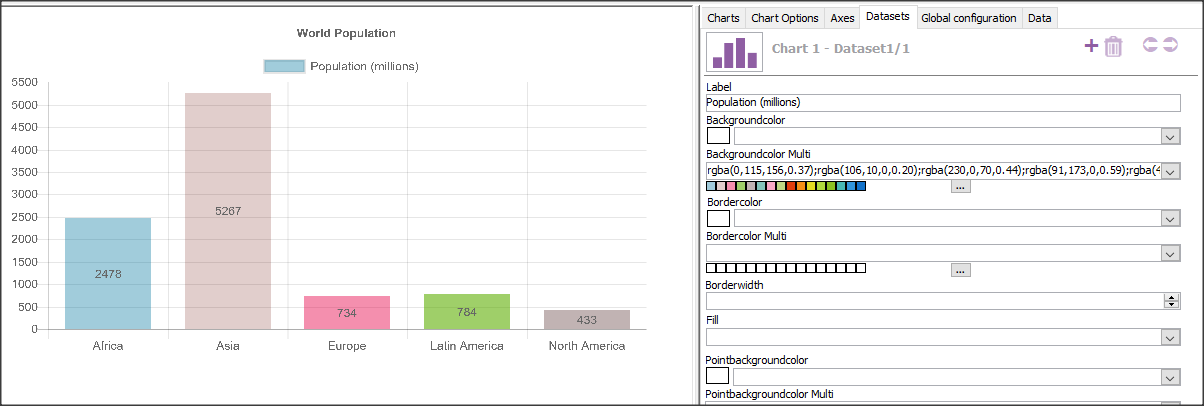
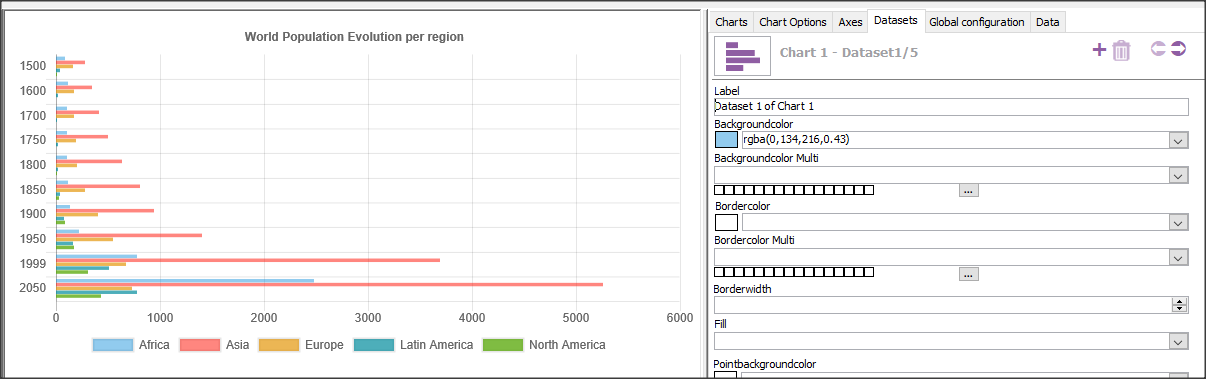
Datasets tab
The dataset is mostly use to specify the colors of each dataset in your chart. For 3 dimensional data, you must specify the parameters for each dataset (series). You must have as many datasets defined as the number of series you data contains.
Global configuration tab.
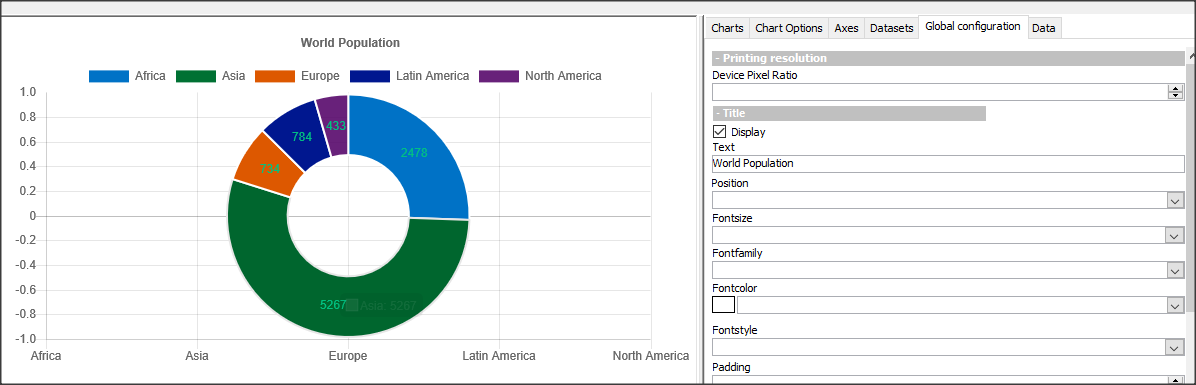
The global configuration tab let you define the global parameters of your graph. It is mainly used to define the Title, the labels and the printing quality if you plan to use the graph in a report.
Depending on the type of chart you have selected, you can define the way it will display (filling, shape of points, data label on chart, tooltips .).
Data tab
The data tab will display your source data datawindow with the sample data you retrieved (or saved within the datawindow object). It lets you modify the data and immediately see the result on the graph.
Copyright © 2021 Werysoft Inc.