You can modify your graph by using the describe and the modify function. The modify function is a little bit different from the standard datawindow one. It takes 2 parameters : the first one references the attribute you want to modify and the second one represent the value you want to assign to that attribute.
To reference an attribute, you first must reference the main level object which correspond to the Tab label in the chart.js datawindow painter.
![]()
chart(n) : Represent the chart number if the graph displays multiple charts (a bar graph and multiple line graphs). Not that the chart options tab properties are accessed via the chart(n) reference.
axes(n) : represent the axes for which you want to access the properties.
dataset(n) : Represent the dataset number n (you must have one dataset per series)
global_configuration : represents all the global configuration properties.
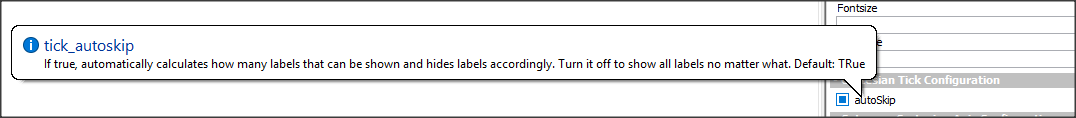
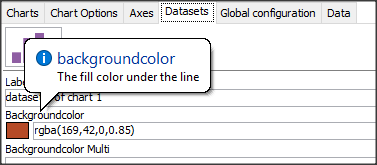
The property name is displayed when you let the mouse cursor over its label in the chart.js datawindow painter. It also displays the meaning of the attribute. For more information on each attribute, you can access the chart.js documentation online at www.chartjs.org.
After you have modify some attributes, you must call the refresh function so that its displays the graph with the modification made.
For example, if you need to dynamically modify the colors of your graph (assuming that it displays 5 datasets/series):
dw_chart_js.modify("chart(1).dataset(1).backgroundcolor","rgba(0,29,95,0.41)")
dw_chart_js.modify("chart(1).dataset(2).backgroundcolor","rgba(126,137,0,0.80)")
dw_chart_js.modify("chart(1).dataset(3).backgroundcolor","rgba(0,113,51,1.00)")
dw_chart_js.modify("chart(1).dataset(4).backgroundcolor","rgba(50,158,0,0.48)")
dw_chart_js.modify("chart(1).dataset(5).backgroundcolor","rgba(0,137,100,0.49)")
dw_chart_js.modify("chart(1).dataset(1).bordercolor","rgba(0,29,95,0.41)")
dw_chart_js.modify("chart(1).dataset(2).bordercolor","rgba(126,137,0,0.80)")
dw_chart_js.modify("chart(1).dataset(3).bordercolor","rgba(0,113,51,1.00)")
dw_chart_js.modify("chart(1).dataset(4).bordercolor","rgba(50,158,0,0.48)")
dw_chart_js.modify("chart(1).dataset(5).bordercolor","rgba(0,137,100,0.49)")
dw_chart_js.refresh()
Note : the chart.js graph engine is based on HTML5 and Javascript. If the modify command you made does not work, you will get a Javascript error and your graph will not display. The attribute syntax must be compliant to javascript and HTML5 syntax.
Copyright © 2021 Werysoft Inc.